
Solution
Energy · Carbon (EMS)
Monitor energy use, per-unit efficiency, and CO₂ emissions (Scope 1·2·3) in real time to cut cost and carbon together and comply with regulations like CBAM.
Power bills and carbon regulation are now the same problem. Collect the meter, flow, and PLC data already on your floor, compute intensity and peaks in real time, and savings and reporting come out of one data flow — no separate metering system required.
A Challenges we solve
No energy-intensity or peak management
Manual emissions accounting and reporting
Regulatory compliance (e.g., CBAM)
Meters with mixed protocols and metering blind spots
B Key capabilities
Energy monitoring
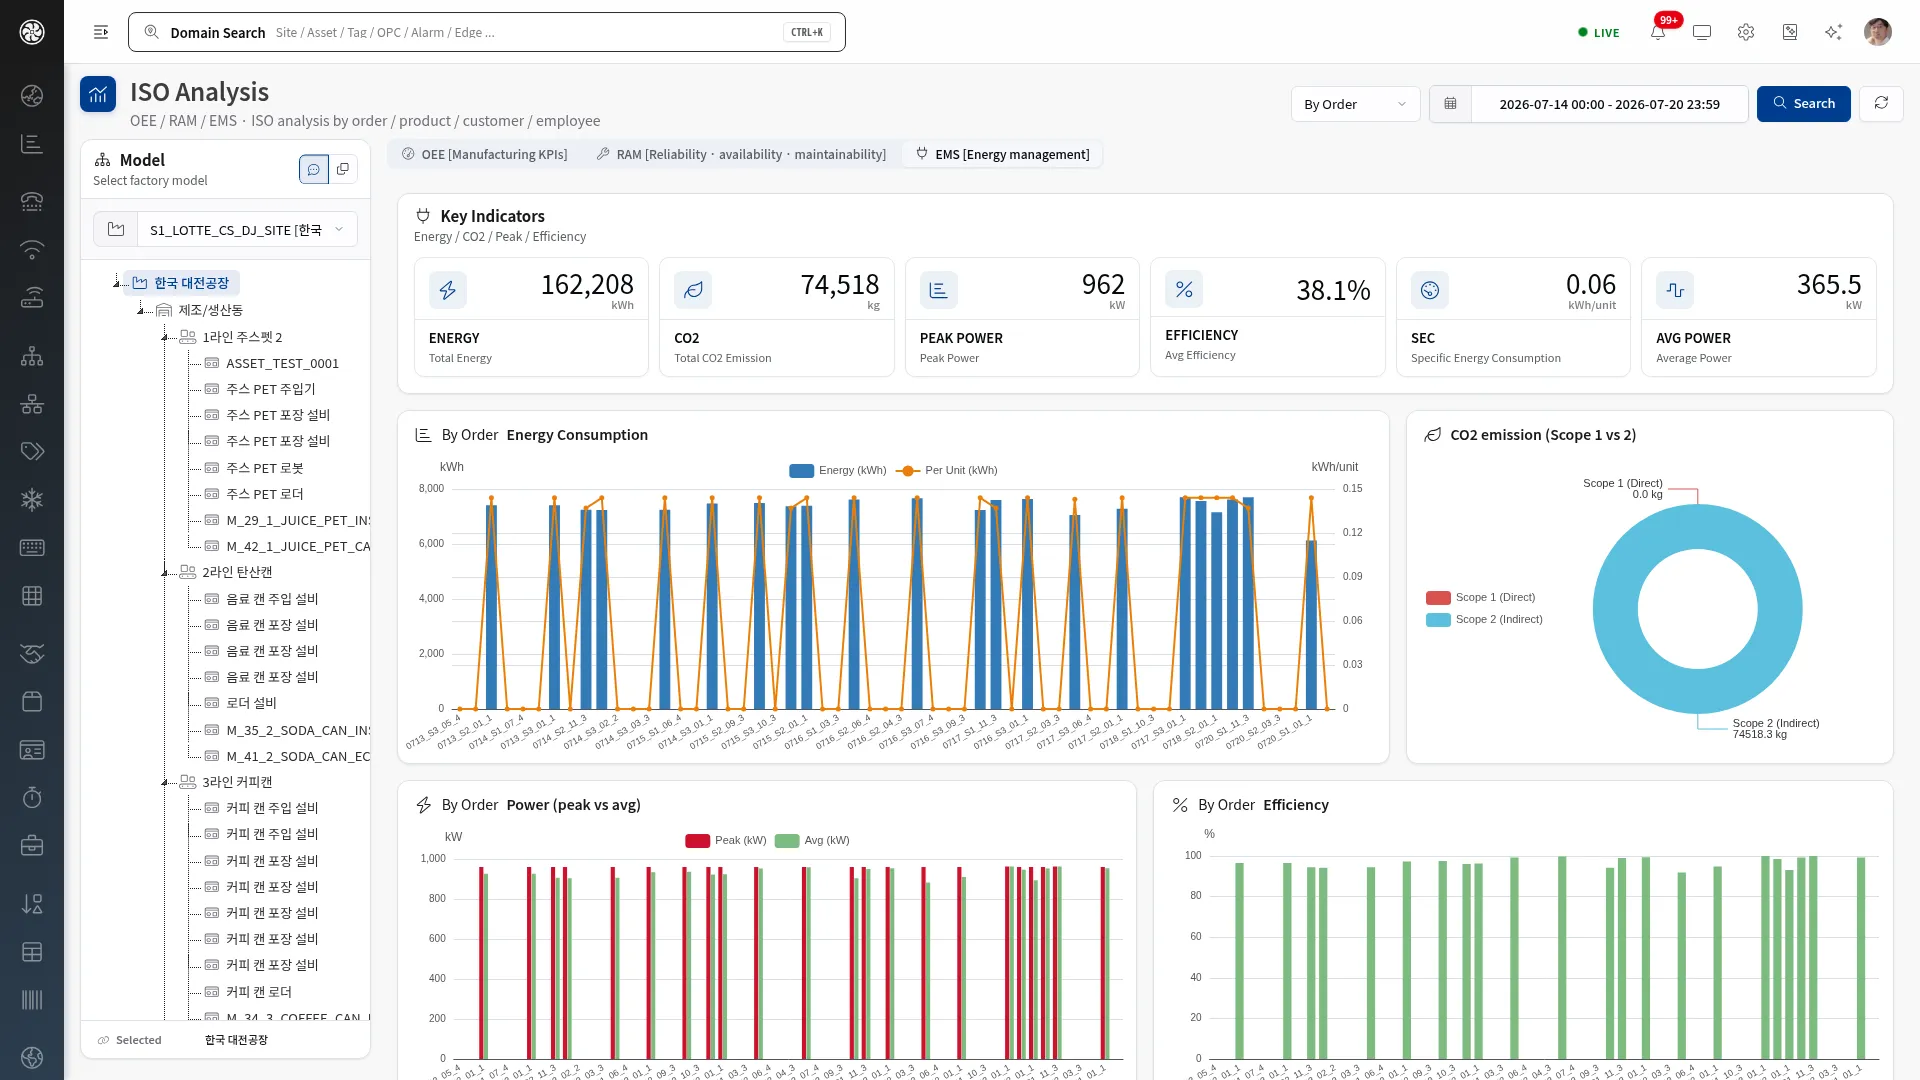
See kWh, intensity, and peak/average power by equipment, line, and site in real time.
Emissions accounting
Calculate and report CO₂ Scope 1·2·3 emissions from data.
Peak demand management
Continuously watch peak/average power and get stream alarms before thresholds are exceeded.
Intensity analysis
Compute energy per unit produced, linked to production actuals and OEE, and compare variance across lines.
Efficiency optimization
Find energy-loss segments and optimize operations.
Automated reporting
Generate periodic energy and emissions reports and deliver them to internal systems with no-code Flow.
C How it works
Metered collection
Connect power meters, flow meters, and PLCs with 42 protocol drivers and collect at millisecond latency.
Asset modeling
Map energy meters onto the ISA-95 asset hierarchy and roll up equipment → line → site.
Analytics & alarms
Compute intensity and peaks in real time and watch thresholds with CEP stream alarms.
Act on savings
Fix loss segments, automate reporting, and ask the AI copilot for causes directly.
5–15%
energy cost savings (estimate)
1·2·3
CO₂ Scope coverage
Real-time
peak & intensity watch
42
meter & equipment protocols
D Where it applies
Compare per-line energy intensity in real time to isolate inefficient lines and time bands, then adjust operating conditions.
Inefficient segments made visible by intensity
Continuously watch cleanroom HVAC and compressed-air peaks and rebalance load on early threshold alarms.
Lower risk of exceeding contracted power
Automate per-equipment emissions accounting from data and generate periodic regulatory reports.
Shorter reporting lead time
C Outcomes
- 5–15% energy cost savings (estimate)
- Emissions visibility
- Regulatory readiness
D Related products
D FAQ
Our meters come from many vendors — can you connect them?
Edge ships 42 industrial protocol drivers including Modbus, collects heterogeneous meters on one gateway, and republishes everything as standard OPC-UA. Adding a meter is a driver selection, not a project.
We already run an EMS/FEMS — can they coexist?
Yes. We collect in parallel over standard protocols and support phased transition. Most sites start by layering intensity, peak, and emissions analytics on top without removing the existing system.
How are emissions calculated?
Collected energy data is aggregated into Scope 1·2·3 with accounting formulas applied, and delivered as periodic reports. The accounting basis is configured per site.
See it live on real operating screens
A 30-minute demo walks you from ingest to AI. Check the fit for your plant with an expert, right away.