
Solution
OEE · ISO Manufacturing KPIs
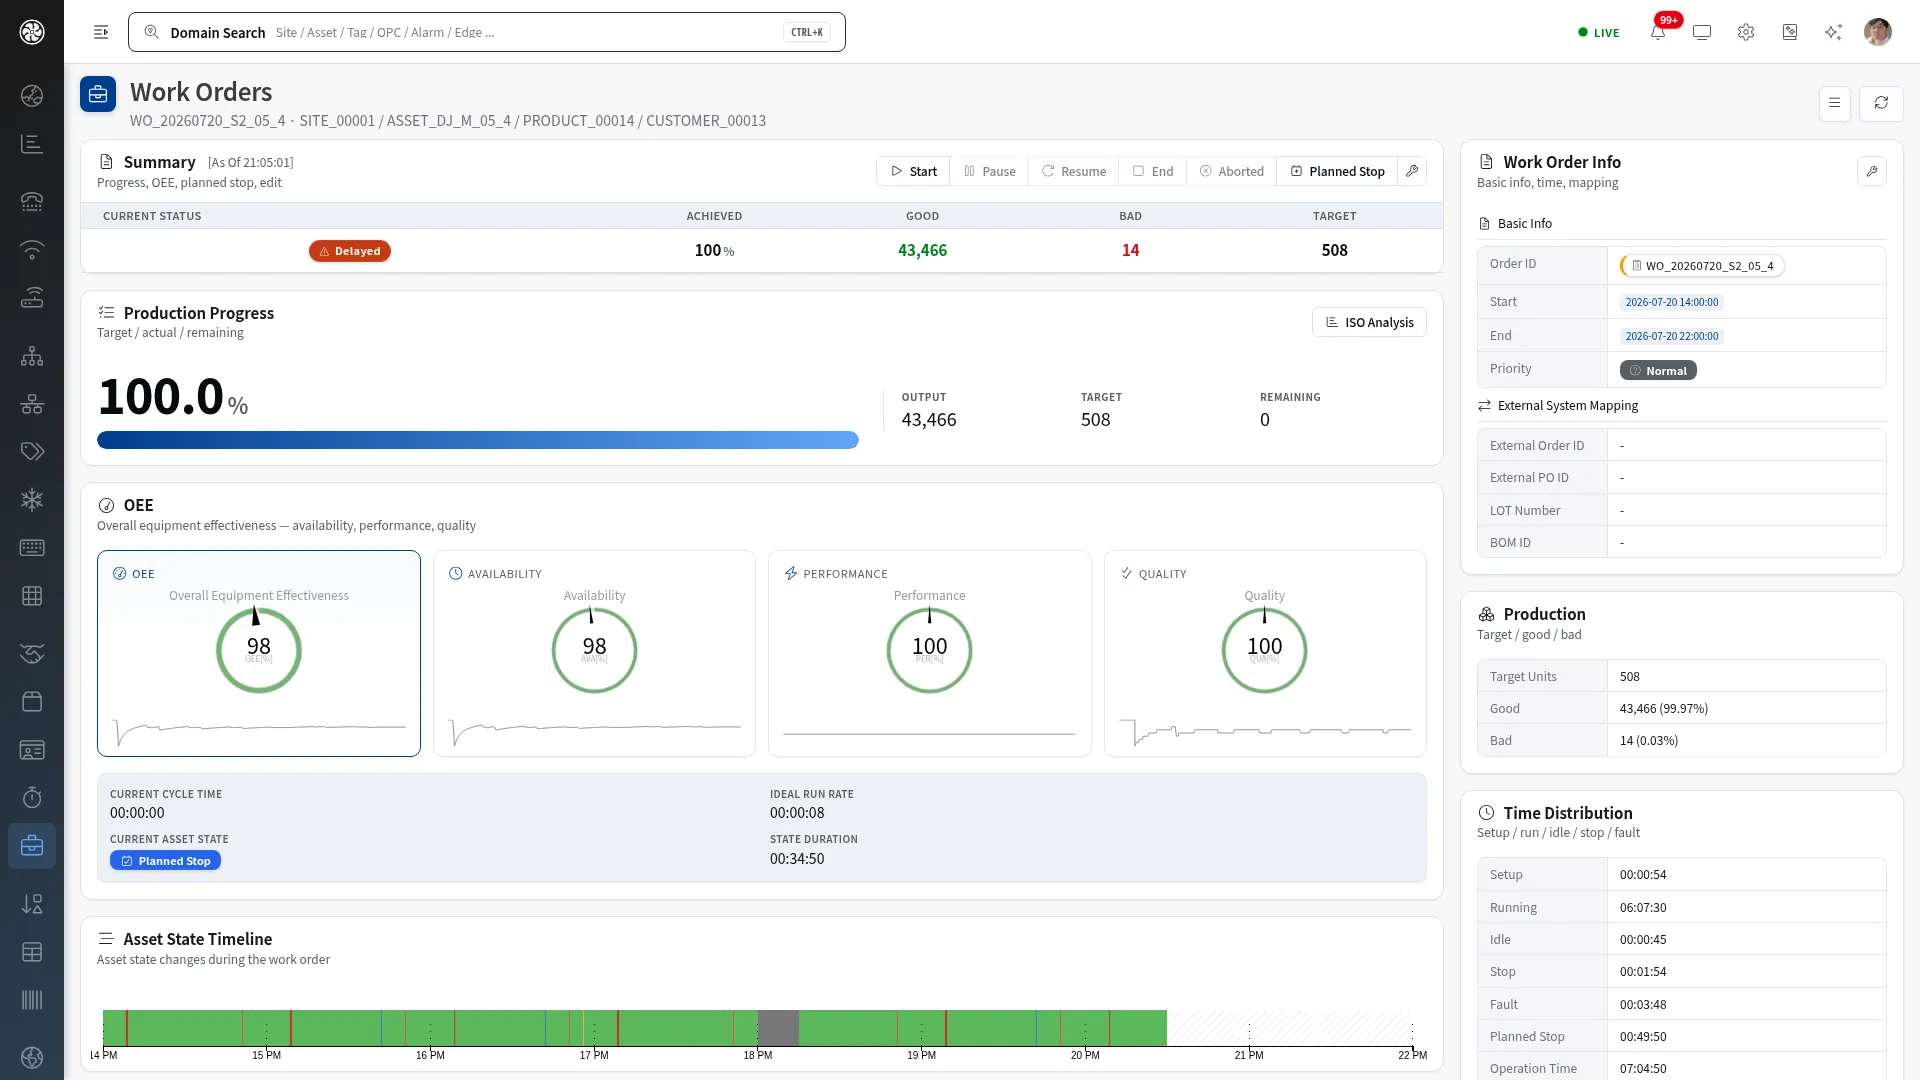
Aggregate availability, performance, and quality in real time to see OEE at a glance and immediately find loss drivers to lift productivity.
OEE is not one number — it is a language for finding loss. PlantPulse® connects edge collection, the ISA-95 asset model, and real-time aggregation in one flow, so you run the improvement cycle on this moment's OEE, not a month-end spreadsheet.
A Challenges we solve
Late OEE visibility from manual aggregation — losses surface at month end
Hard to separate availability, performance, and quality losses
No variance tracking or drill-down across lines and equipment
Inaccurate availability when shifts and planned stops are ignored
B Key capabilities
Real-time OEE
Compute availability × performance × quality the moment data arrives. See today's OEE, not last month's reconciliation.
Loss breakdown
Separate downtime, speed loss, and defects to pinpoint the root of loss through the six-big-losses lens.
Line/equipment compare
Compare OEE across the ISA-95 hierarchy (site→area→line→equipment) and drill down to the problem asset.
Shift & production calendar
Account for shifts, breaks, and planned maintenance to compute true planned production time — real OEE, not nominal OEE.
Standardized stop reasons
Codify downtime reasons to build stop history by equipment, line, and period — and catch recurring losses.
Shop-floor TV boards
Publish Studio-built OEE dashboards full-screen to shop-floor TVs and control-room displays.
C How it works
Collect
Edge ingests machine signals, production counts, and reject signals over 42 industrial protocols at millisecond latency.
Standardize
Map lines, equipment, and tags onto the ISA-95 hierarchy and ontology.
Aggregate & analyze
Compute availability, performance, and quality on the live stream and decompose losses automatically.
Act
Share losses via dashboards, alarms, and reports — and ask the AI copilot for root causes on the spot.
A·P·Q
three factors, live
8ms
edge ingest latency
ISA-95
standard asset hierarchy
3–8pp
OEE lift (deployment estimate)
D Where it applies
OEE varied widely across juice, soda, and coffee filling lines, and manual aggregation could not isolate why.
Live OEE across all lines · top loss contributors identified
Sorter and conveyor availability and throughput needed unified monitoring on OT data.
One screen for equipment availability and performance
Lines mixed equipment of different makers and vintages, so standardized count collection came first.
Standard collection across heterogeneous lines → fair OEE comparison
C Outcomes
- OEE up 3–8pp (estimate)
- Instant loss visibility
- An established data-driven improvement cycle
D Related products
D FAQ
Can it integrate with our MES and ERP?
Yes. REST APIs (150+ V5 endpoints), database connectors, and Flow's JDBC polling exchange plans, work orders, and actuals in both directions.
Can older equipment feed OEE?
Edge ships 42 industrial protocol drivers (LS, Mitsubishi MELSEC, Modbus, OPC-UA, and more) to read legacy PLCs and heterogeneous machines directly. For signal-less assets we design sensor retrofits alongside.
How long does deployment take?
With standard OEE templates and Studio app generation, a pilot line typically starts as a several-week PoC, then scales by line and site after validation.
See it live on real operating screens
A 30-minute demo walks you from ingest to AI. Check the fit for your plant with an expert, right away.