
Solution
Timeseries Analytics
Ingest millisecond-level sensor streams into an event/time-series database at high speed, then query and visualize instantly by period, tag, and quality. Trend comparison and interval replay explain your plant's yesterday and today with data.
OEE, predictive maintenance, digital twins — they all stand on time series. How fast you can store and retrieve it is the speed of your analysis, and the speed of your analysis is the speed of your response.
A Challenges we solve
Storage performance and cost for high-frequency data
Query speed across tens of thousands of tags
Restoring context around an anomaly
Analysis scattered across per-team tools
B Key capabilities
High-speed ingestion
8ms edge latency and a pipeline handling tens of thousands of messages per second ingest high-frequency sensors without loss.
Time-series query
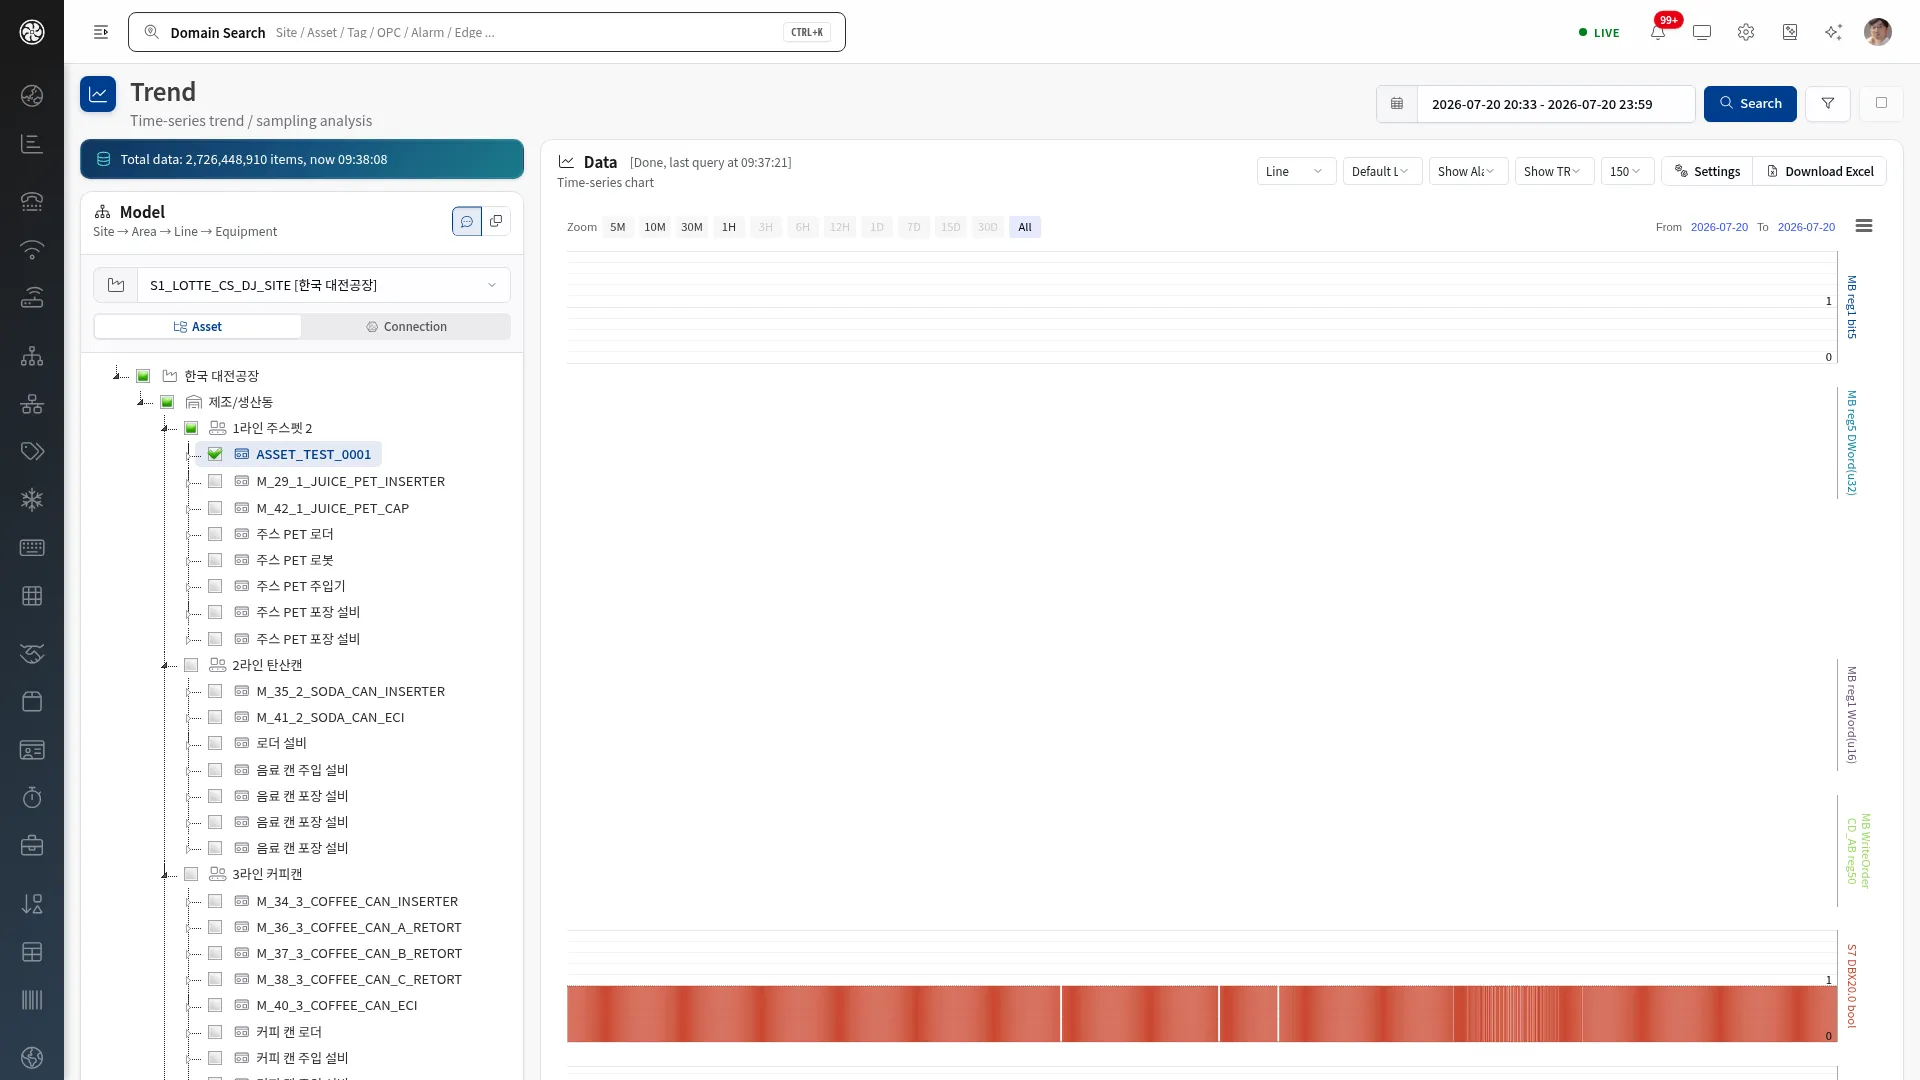
Search points instantly by period, collector, tag, and quality, and view results as tables and charts.
Trend & comparison
Overlay multiple tags to compare trends and see variance across lines and equipment visually.
Interval replay
Rewind and replay the window around an incident to restore the order and context of signal changes.
Quality codes
Every point is stored with its collection-quality code, so you can judge how much to trust each result.
AI anomaly link
Learn per-tag baselines from accumulated series and detect deviations continuously.
C How it works
Collect
Edge ingests high-frequency signals over 42 protocols at 8ms latency.
Store
Load into the event/time-series database and in-memory cache, managed by retention policies.
Query & visualize
Pull any window instantly with time-series queries, trend charts, and dashboards.
Analyze & predict
AI learns baselines to flag deviations; replay analysis narrows the cause.
8ms
edge ingest latency
40K
messages ingested/sec
100TB+
data processed
512K
CEP events/sec
D Where it applies
Compare long-term drift in cleanroom equipment signals to catch degradation early.
Early detection of subtle anomalies
Judge maintenance timing from vibration and temperature series compared against baselines.
Condition-based maintenance evidence
Replay the window around a line stop to restore which signal broke down first.
Faster stop root-cause analysis
C Outcomes
- Earlier anomaly awareness
- Faster root-cause analysis
- Condition-based decisions
D Related products
D FAQ
Won't storage costs explode?
Retention policies and downsampling tier raw and aggregated data — recent windows at full resolution, long-term windows as aggregates.
Does it replace our historian?
It can collect in parallel over standard protocols with phased transition. Applying it to new lines while keeping the existing system is also supported.
Can data-science tools use it?
Time series is available over REST APIs for your analytics tools and notebooks. For floor-level analysis, the built-in query and dashboards are usually enough.
See it live on real operating screens
A 30-minute demo walks you from ingest to AI. Check the fit for your plant with an expert, right away.